Overview
You can create spreadsheets directly in the wiki.

To create a new spreadsheet:
- Select New spreadsheet from the "new"-menu.
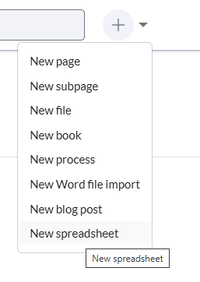
Create spreadsheet - Enter a name for your spreadsheet.
- Click Create. The spreadsheet opens in edit mode. The spreadsheet opens in edit mode. You can switch to Fullscreen view if you want to add many columns.
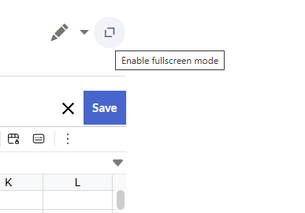
enable fullscreen mode - Click Save to save your spreadsheet.


Page name:Each spreadsheet in the wiki has the extension .sheet as part of its pagename.
Displaying table information
Showing a data range
You can include a range of continuous data from a wiki spreadsheet on another page.

To extract a data range from the spreadsheet on a page:
- Open the Content Droplets menu in visual editing mode.
- Search for Spreadsheet data.
- Insert the content droplet on the page.
- Fill in the information for the data range:
- Spreadsheet page: Name of your existing spreadsheet page
- Range to select: A continuous range of cells to select, separated by a colon (e.g.: A1:E5)
- Format: Table creates a table of class "wikitable", plainlist creates a comma-separated list of values
- Separator:
This inserts the tag
on the page.
Showing a data gauge
You can compare the current value of a cell to a target value and show the status in a gauge format.

To display a gauge chart for a selected spreadsheet value:
- Open the Content Droplets menu in visual editing mode.
- Search for Spreadsheet data gauge.
- Insert the content droplet on the page.
- Fill in the information for the data gauge:
- Spreadsheet page: Name of your existing spreadsheet page
- Cell to gete value from: Cell that contains the number value you want to track
- Format: Gauge, Progress bar
- Minimum value: Starting value to calculate from
- Maximum value: End value to calculate to
- Display size (in px): Output size of the graphic.
- Color: Web color of the calculated valuel .
This inserts the tag <sheetdata:gauge page="Sales data.sheet" min="1" max="100000" format="gauge" size="100" stroke="#4caf50" cell="F4" /> on the page.
List of all spreadsheets
A list of all spreadsheets can be shown or hidden by administrators under the entrypoint links in the main navigation. You can also manually link to the page Special:SpreadsheetList.